
Steam Data Suite's Sales Intelligence Solutions
- April 4, 2022
- 5:25 pm

We all know of the struggle that comes with analyzing your Steam portfolio’s sales performance. Trying to avoid the Steamworks altogether, most publishers ( or: of you) export their sales data from Steamworks in CSV and perform the analysis externally. This is a sound approach if you have ready-built dashboards at your disposal with which you can properly visualize the data. Building these dashboards, however, takes time, and might not always be a feasible, or cost-efficient solution. At Steam Data Suite we have embraced this reality and have come up with solutions that make manual sales analysis obsolete.
Steam Data Suit Sales Intelligence Solutions
Portfolio Analysis
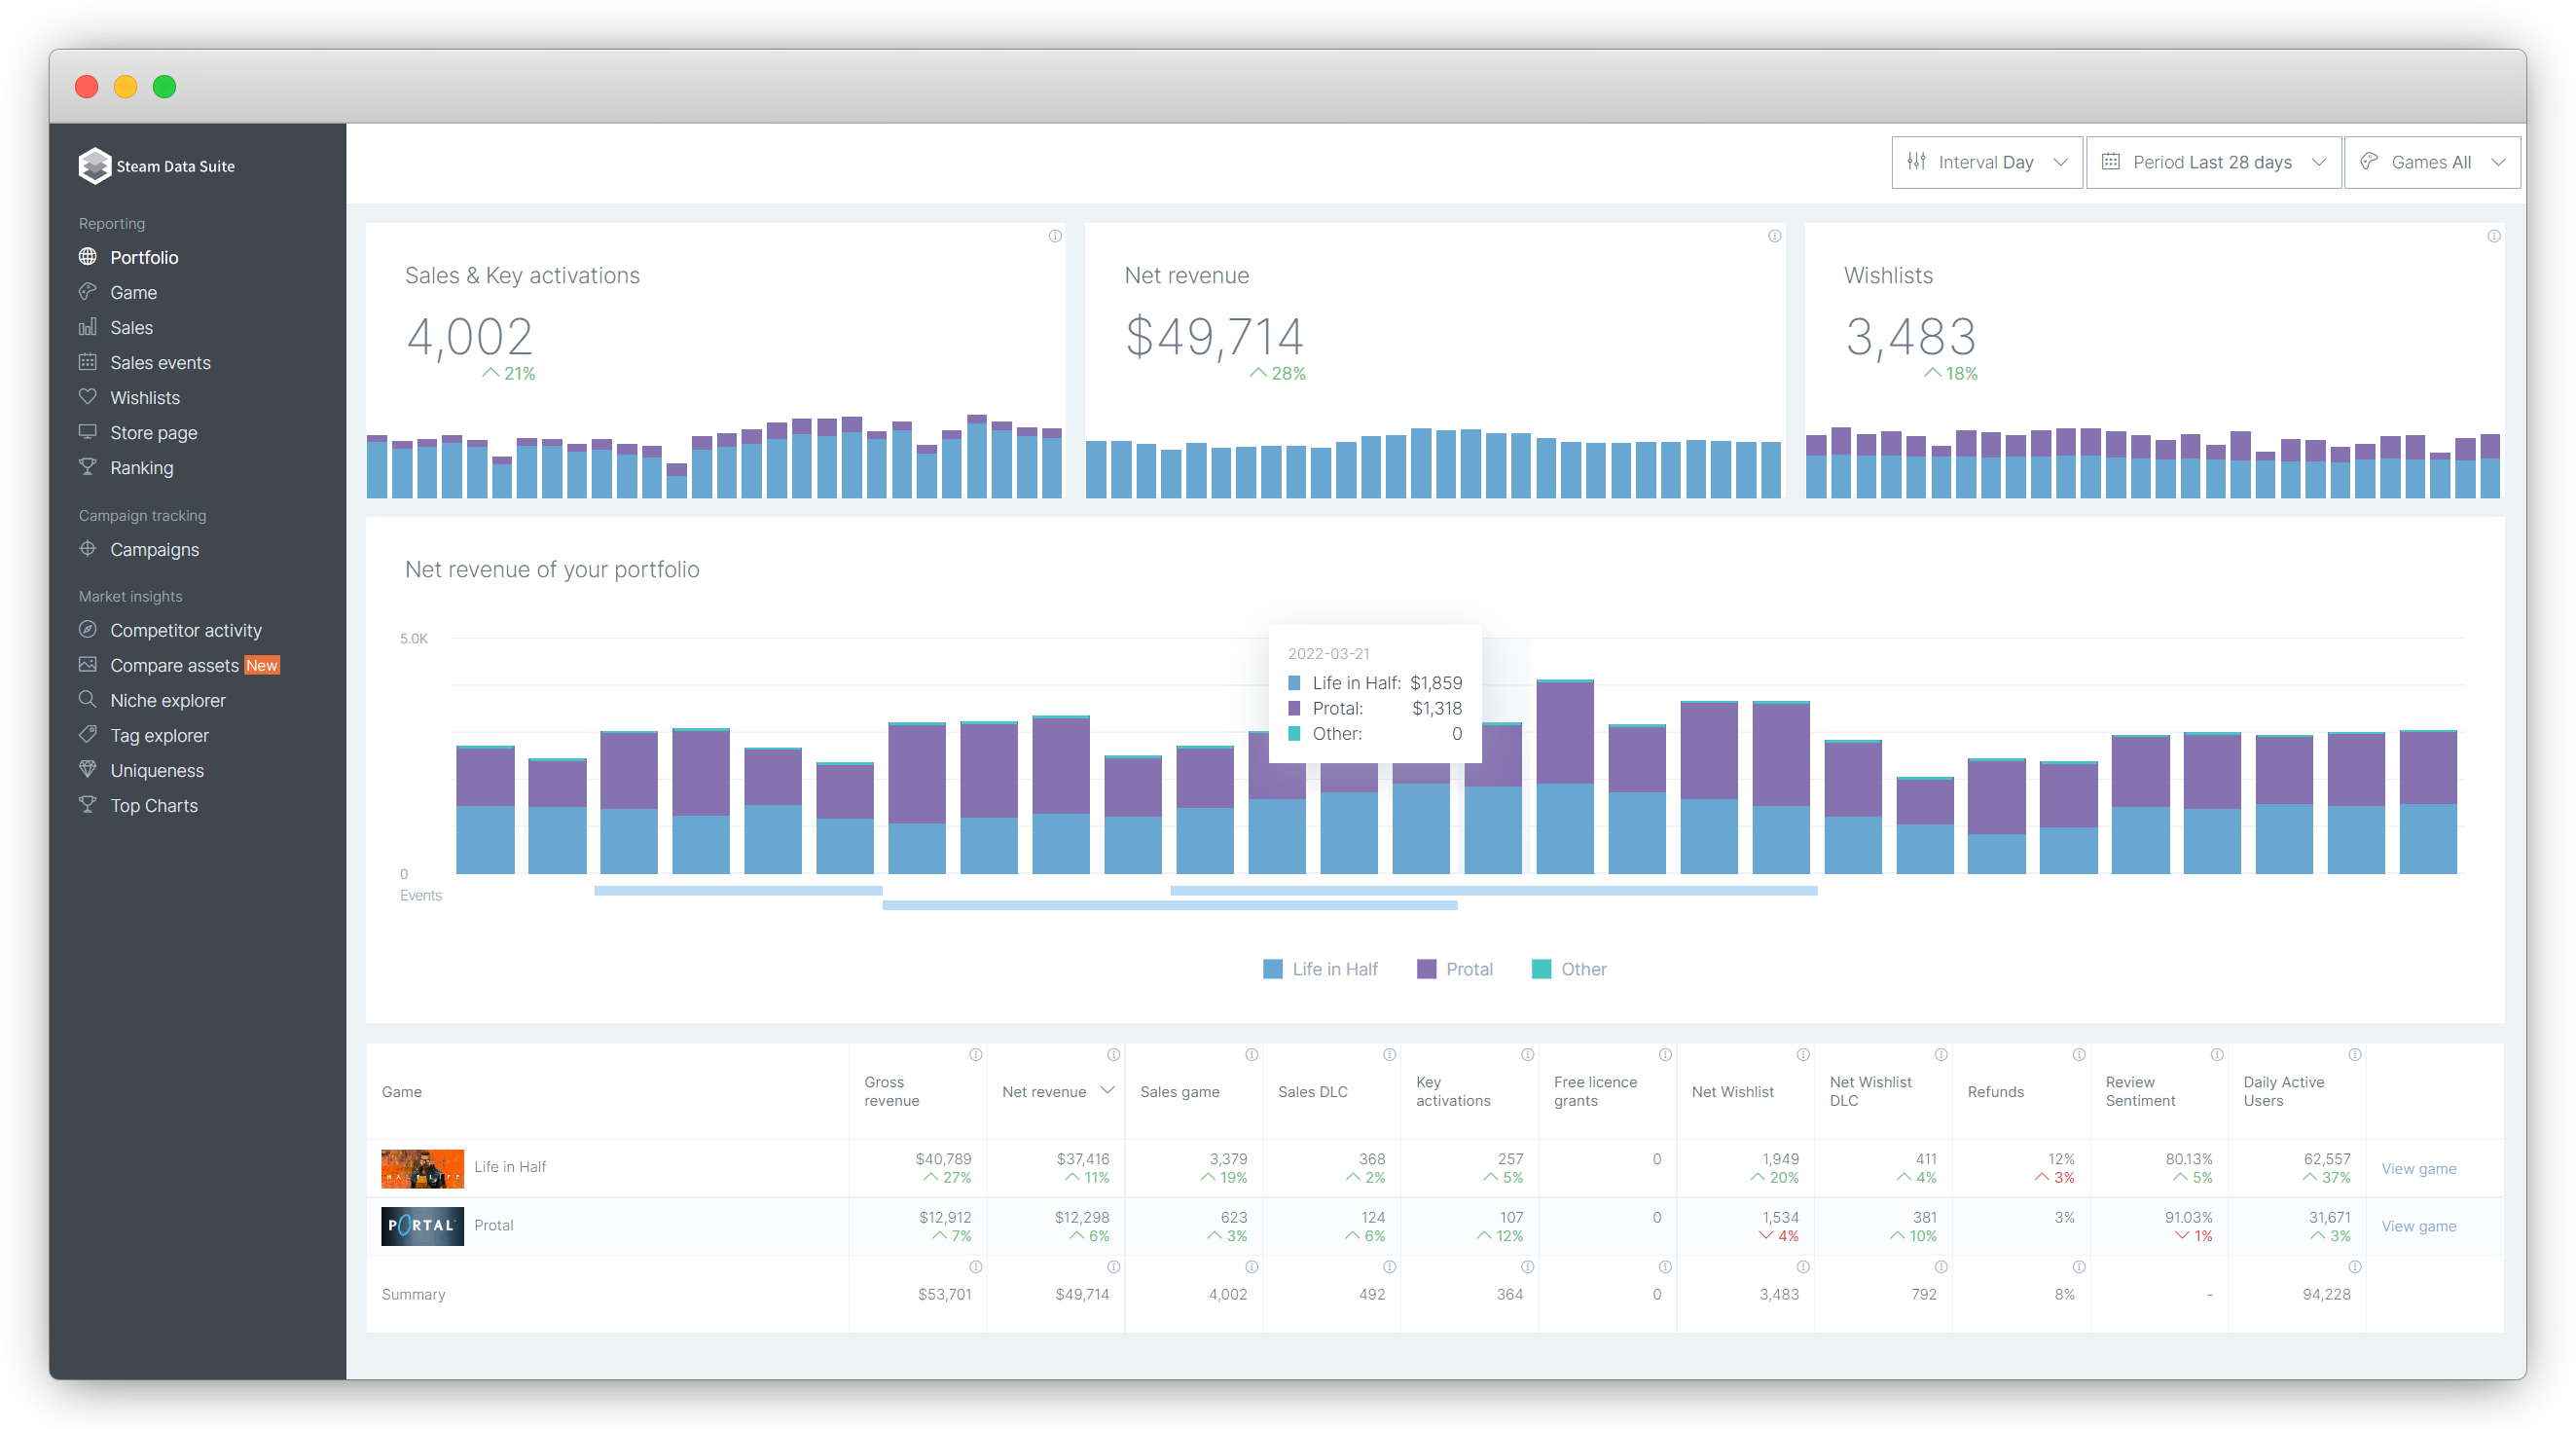
The Portfolio page provides you with a clear overview of your entire Steam catalog’s sales performance. If you lack the time to assess each of your games’ performance metrics, you can consult the portfolio page for a glanceable analysis of the most important KPIs of your entire portfolio, or per game, including:
- Sales & Key activations
- Net revenue
- Wishlists
Game Analysis
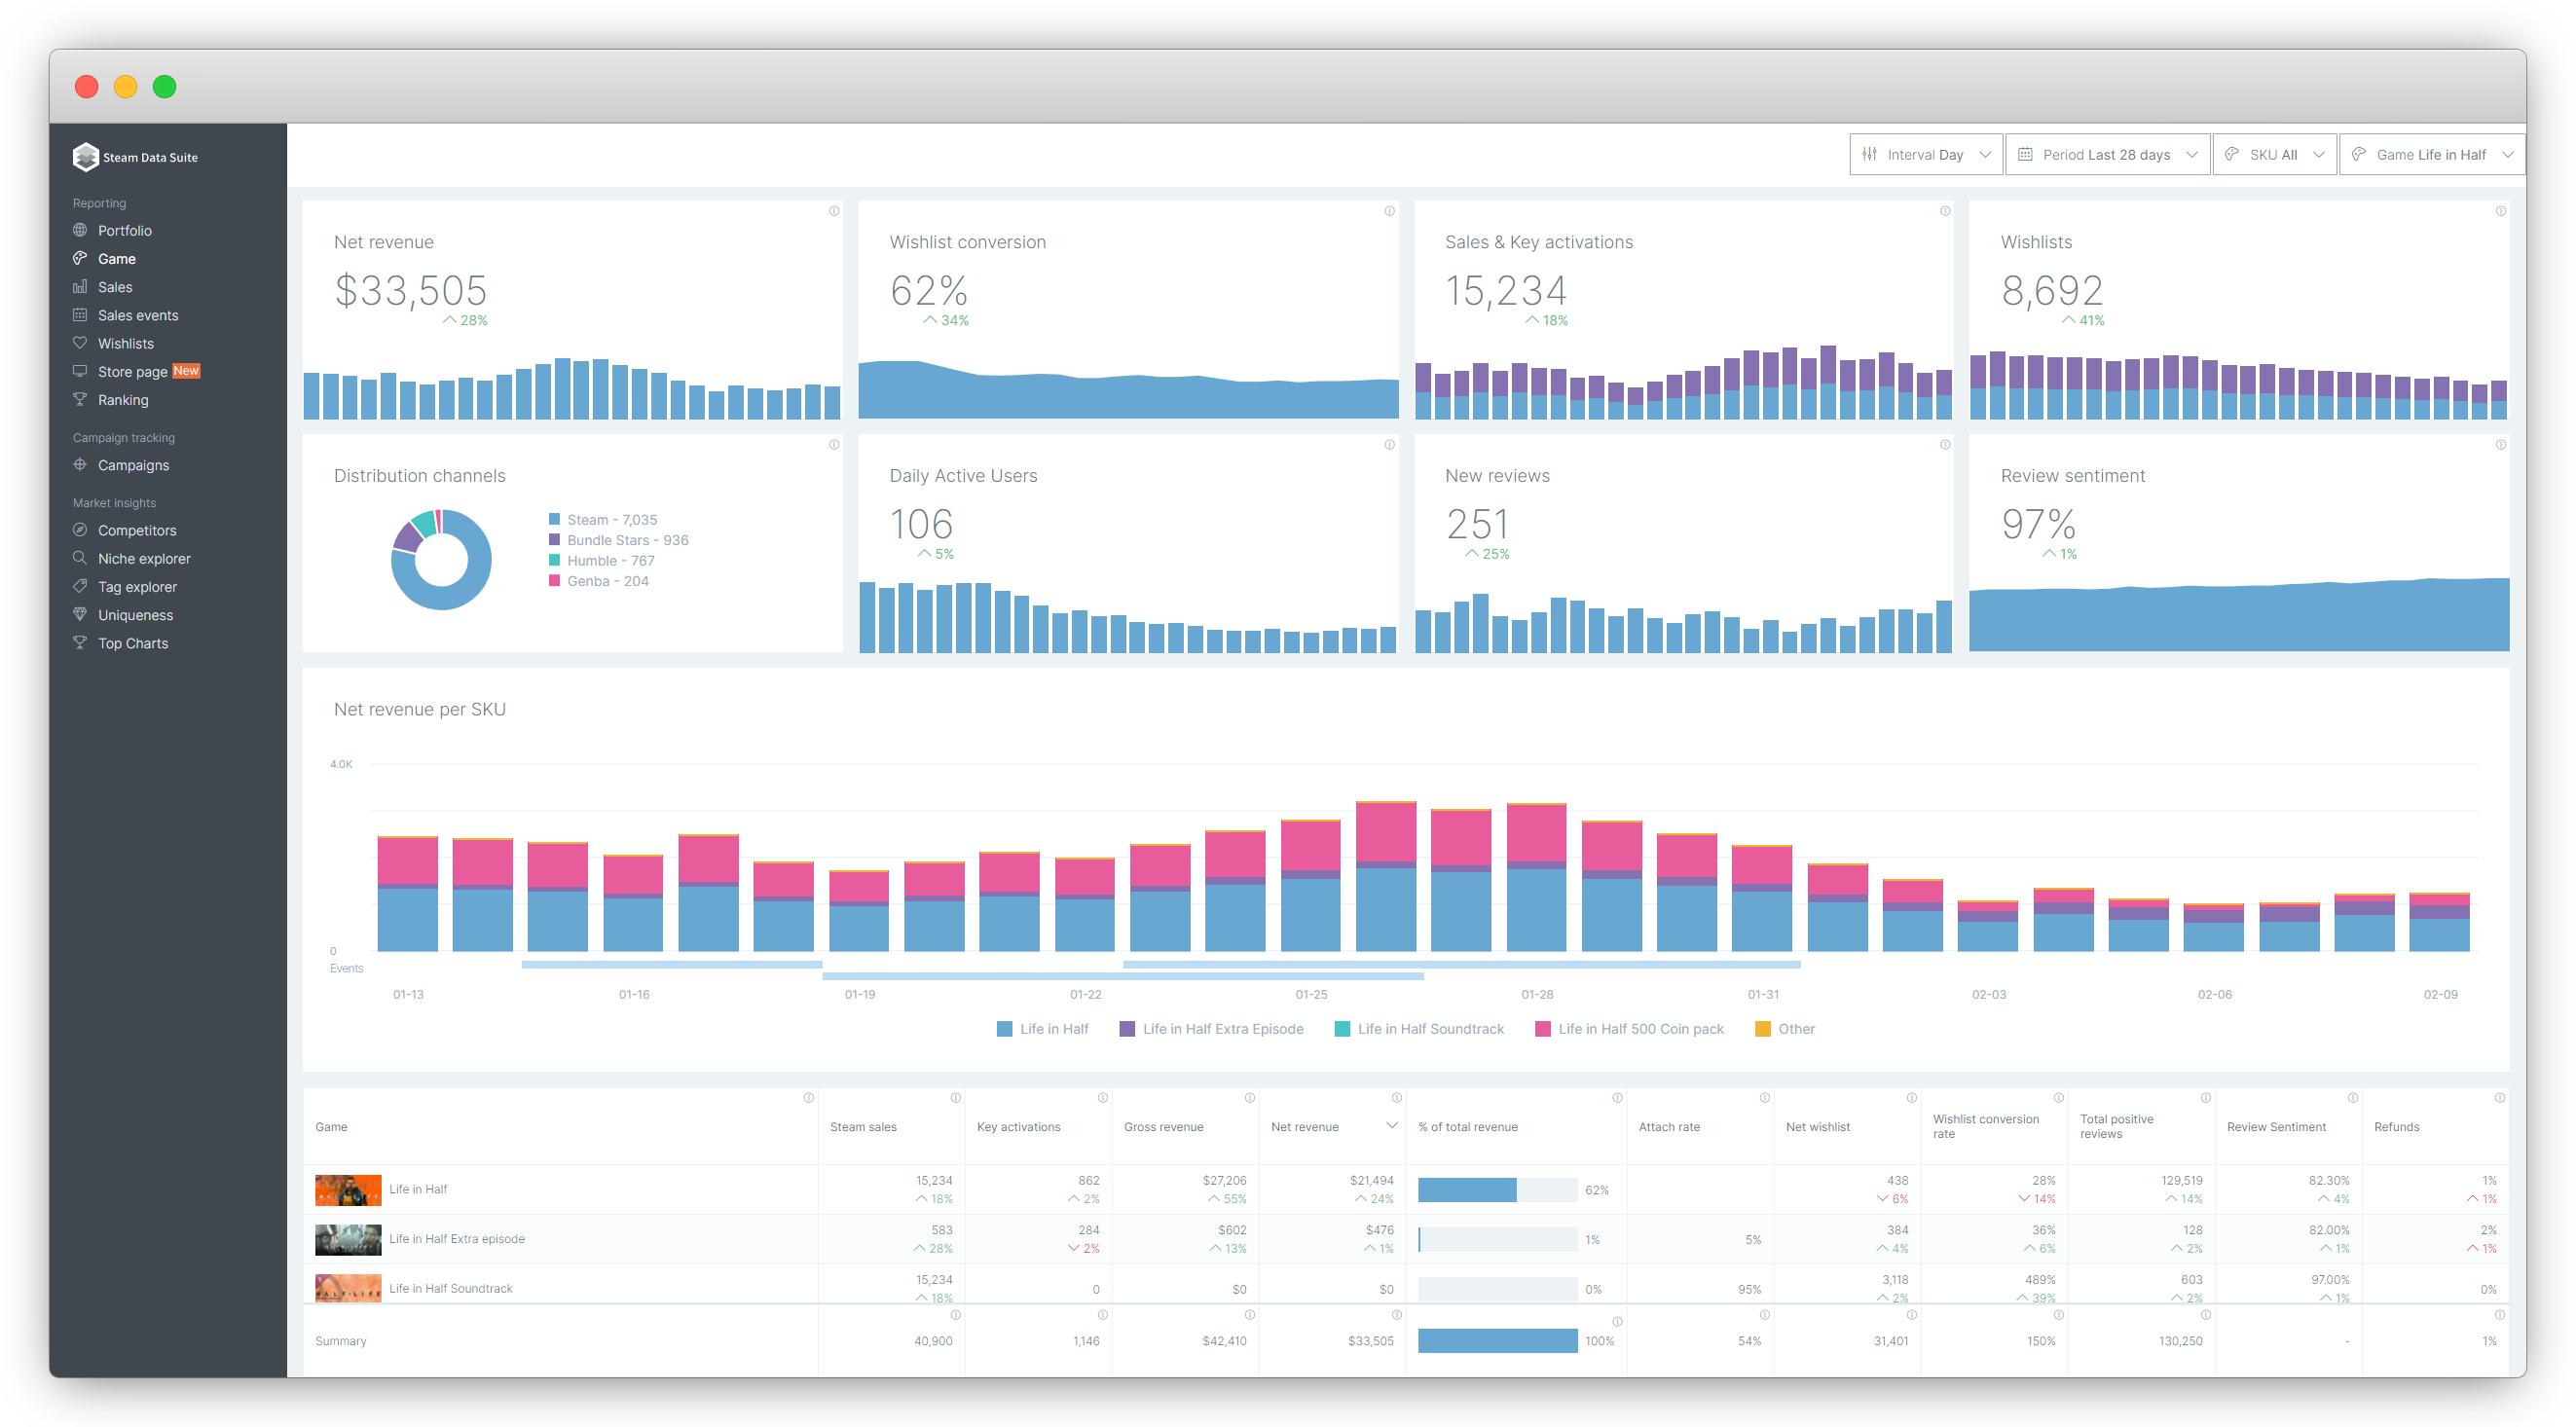
If you want to take a more granular, in-depth look at the performance of one specific game, the Game Analysis page holds all the answers. Providing you with all relevant metrics, from net revenue to DAU, review sentiment, and refund rate, the game analysis page consolidates several sales performance pages from Steamworks in one. In addition, the page reports all relevant performance metrics of the selected game’s SKUs. In the future, the game dashboard will provide customizability, so it provides only those metrics that are most relevant to you. To summarize, the game dashboard reports, per game:
- Net revenue
- Sales & Key activations
- Refunds
- Attach rate
- Wishlist conversion
- Wishlist balance
- Daily Active Users
- New reviews
- Review sentiment
- Total positive reviews
Sales
The Sales page informs you where your games sell the most as well as the share of revenue that each country, distribution channel, and platform generate, respectively. If you are looking for opportunities for localization, the Sales page will provide you with answers. Also, if you distribute a considerable number of keys outside Steam, the tool lets you assess how well they are selling across multiple platforms. (Tip: Make sure to label all your key batches correctly to get the most meaningful insights). Finally, the Sales page reports how your games’ player base distributes across all platforms as well as their respective sales & key activations, revenue, and refund performances. The whole range of insights the sales tool provides includes:
- Net revenue per country
- Share of revenue per country
- Total sales per country
- Sales per channel
- Distribution share per channel
- Sales & key activations per platform
- Share of total sales per platform
- Revenue per platform
- Share of total revenue per platfrom
- Refunds per platform

Sales Events
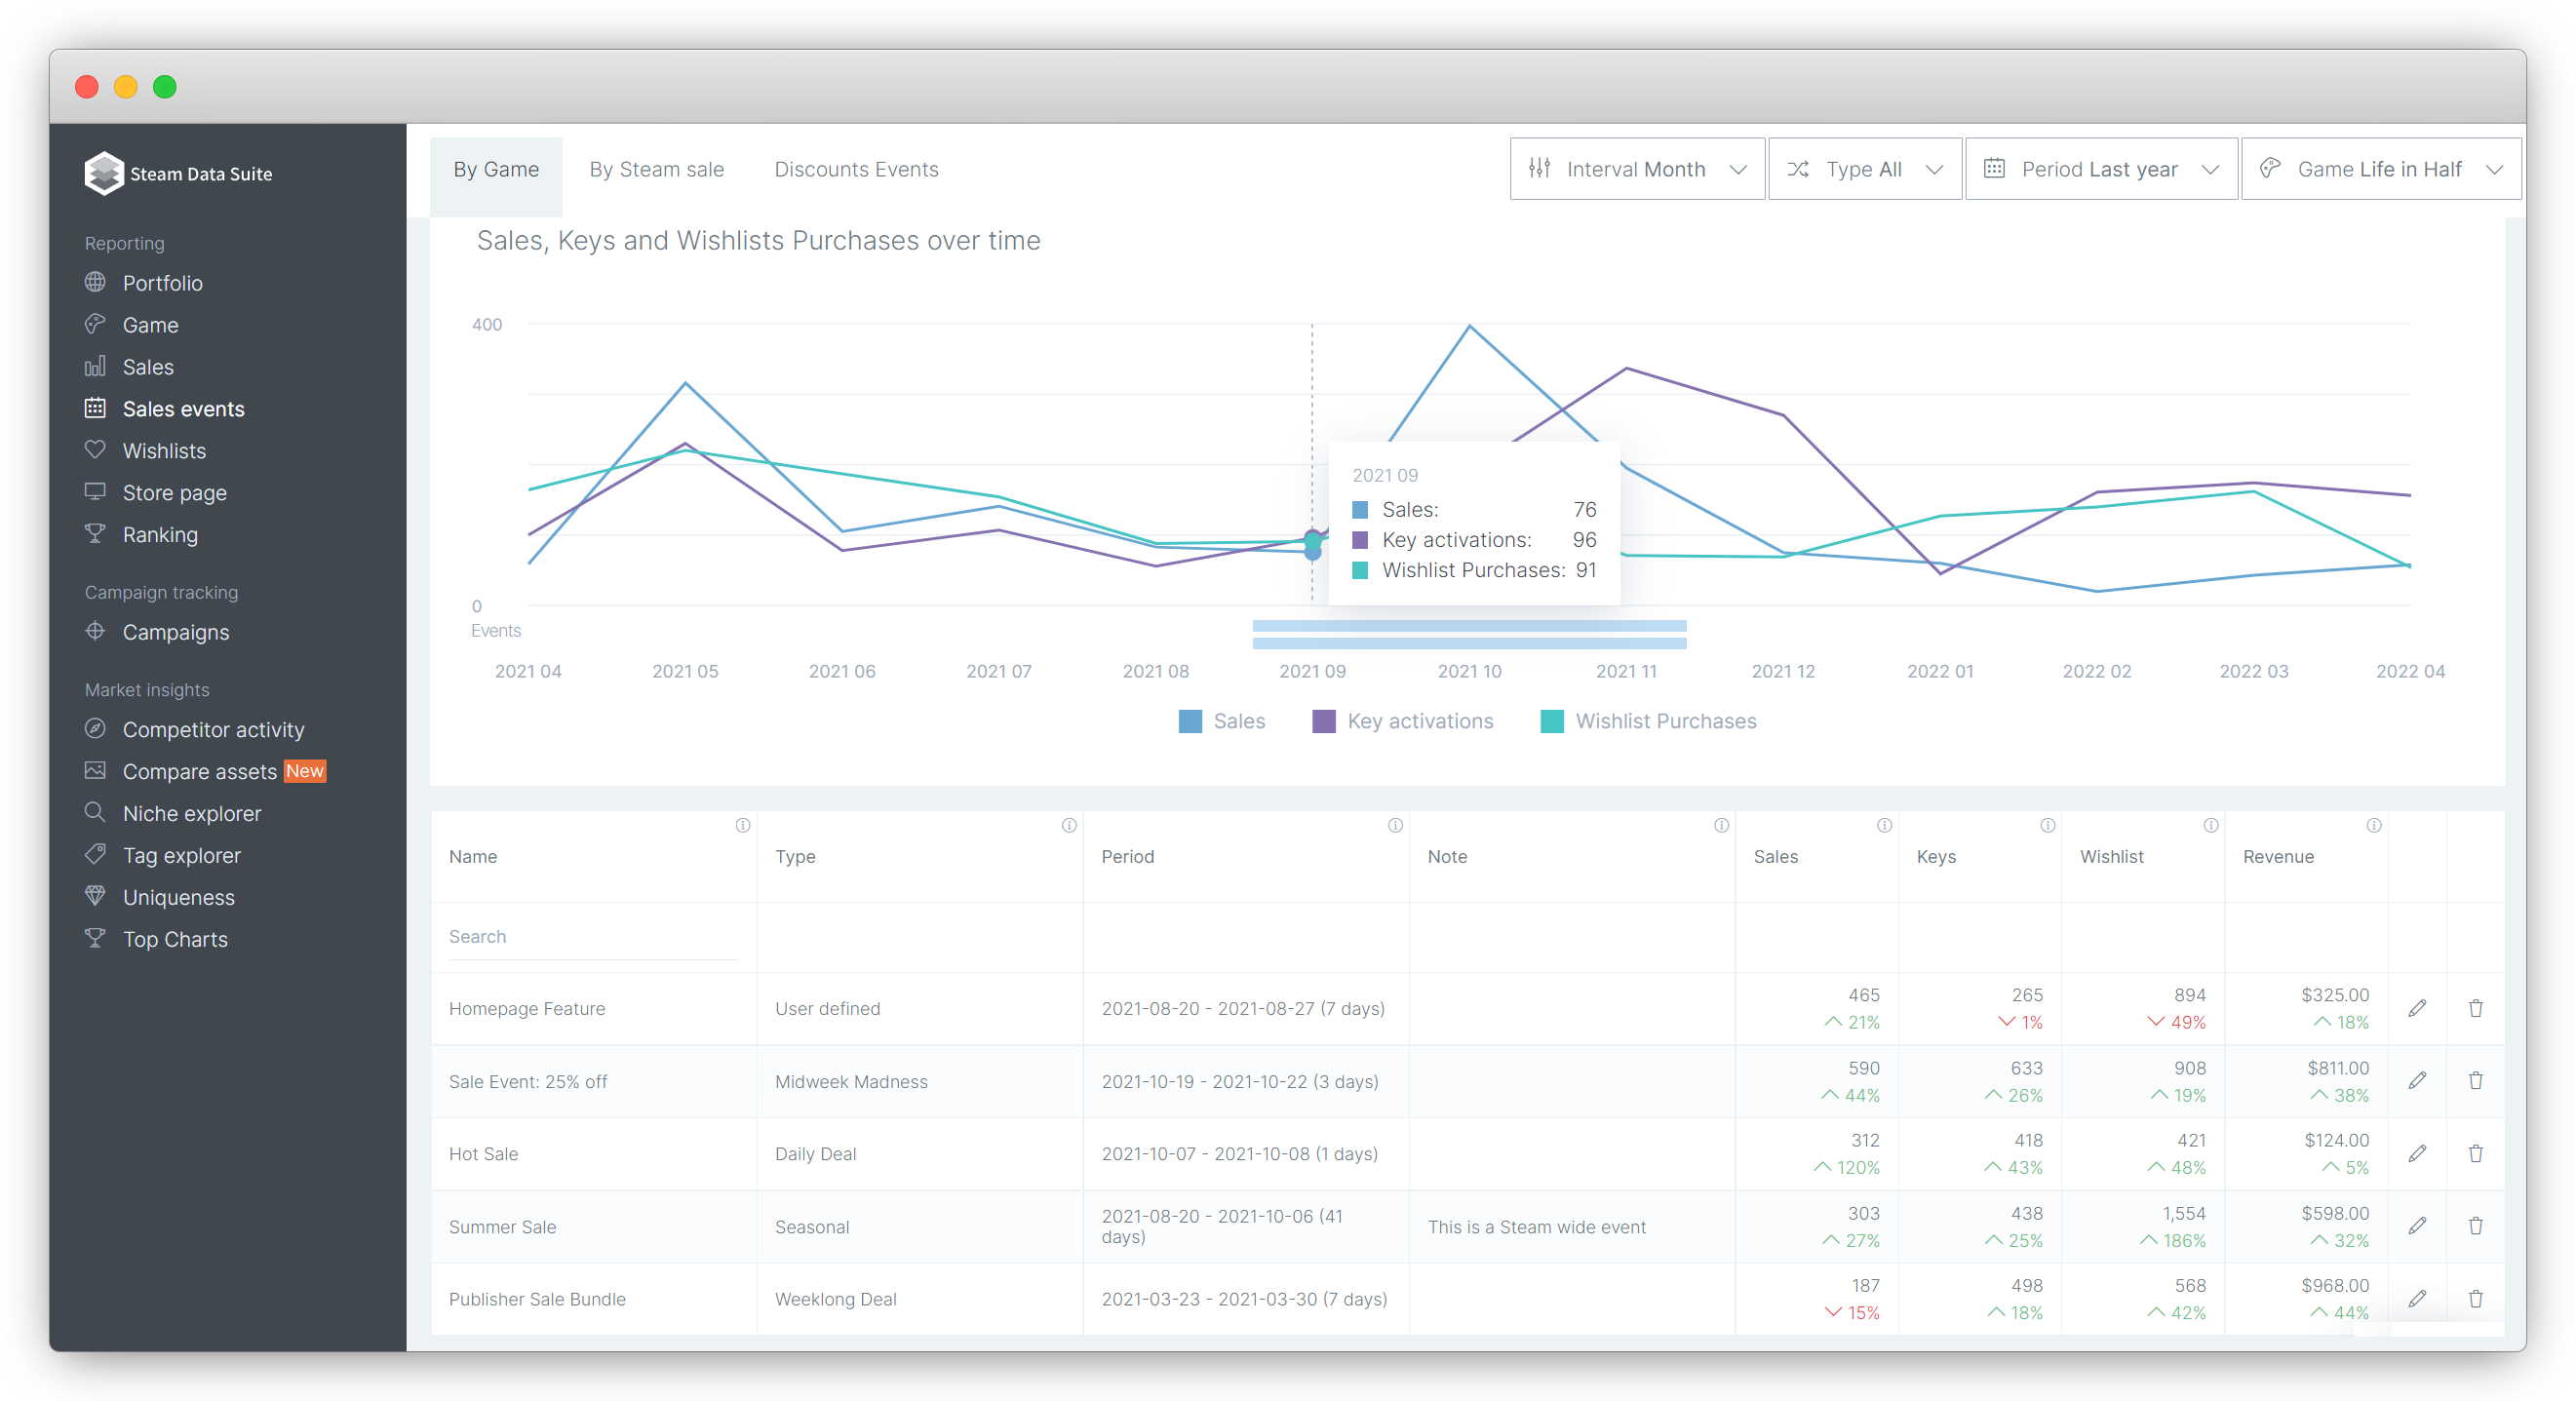
The sales events tool automatically detects the periods during which a game was on sale and reports all critical metrics for that period and compares them to prior sales. You can also create custom events to make sure that any change in these metrics that can be attributed to an event is accounted for. That way, you can evaluate the performance of various discounts across multiple events to identify the discount percentage that generates the most sales and net revenue for each of your games. Metrics reported in the sales event tool include:
- Average price
- Discount
- Sales
- Keys
- Wishlist
- Revenue
Wishlists
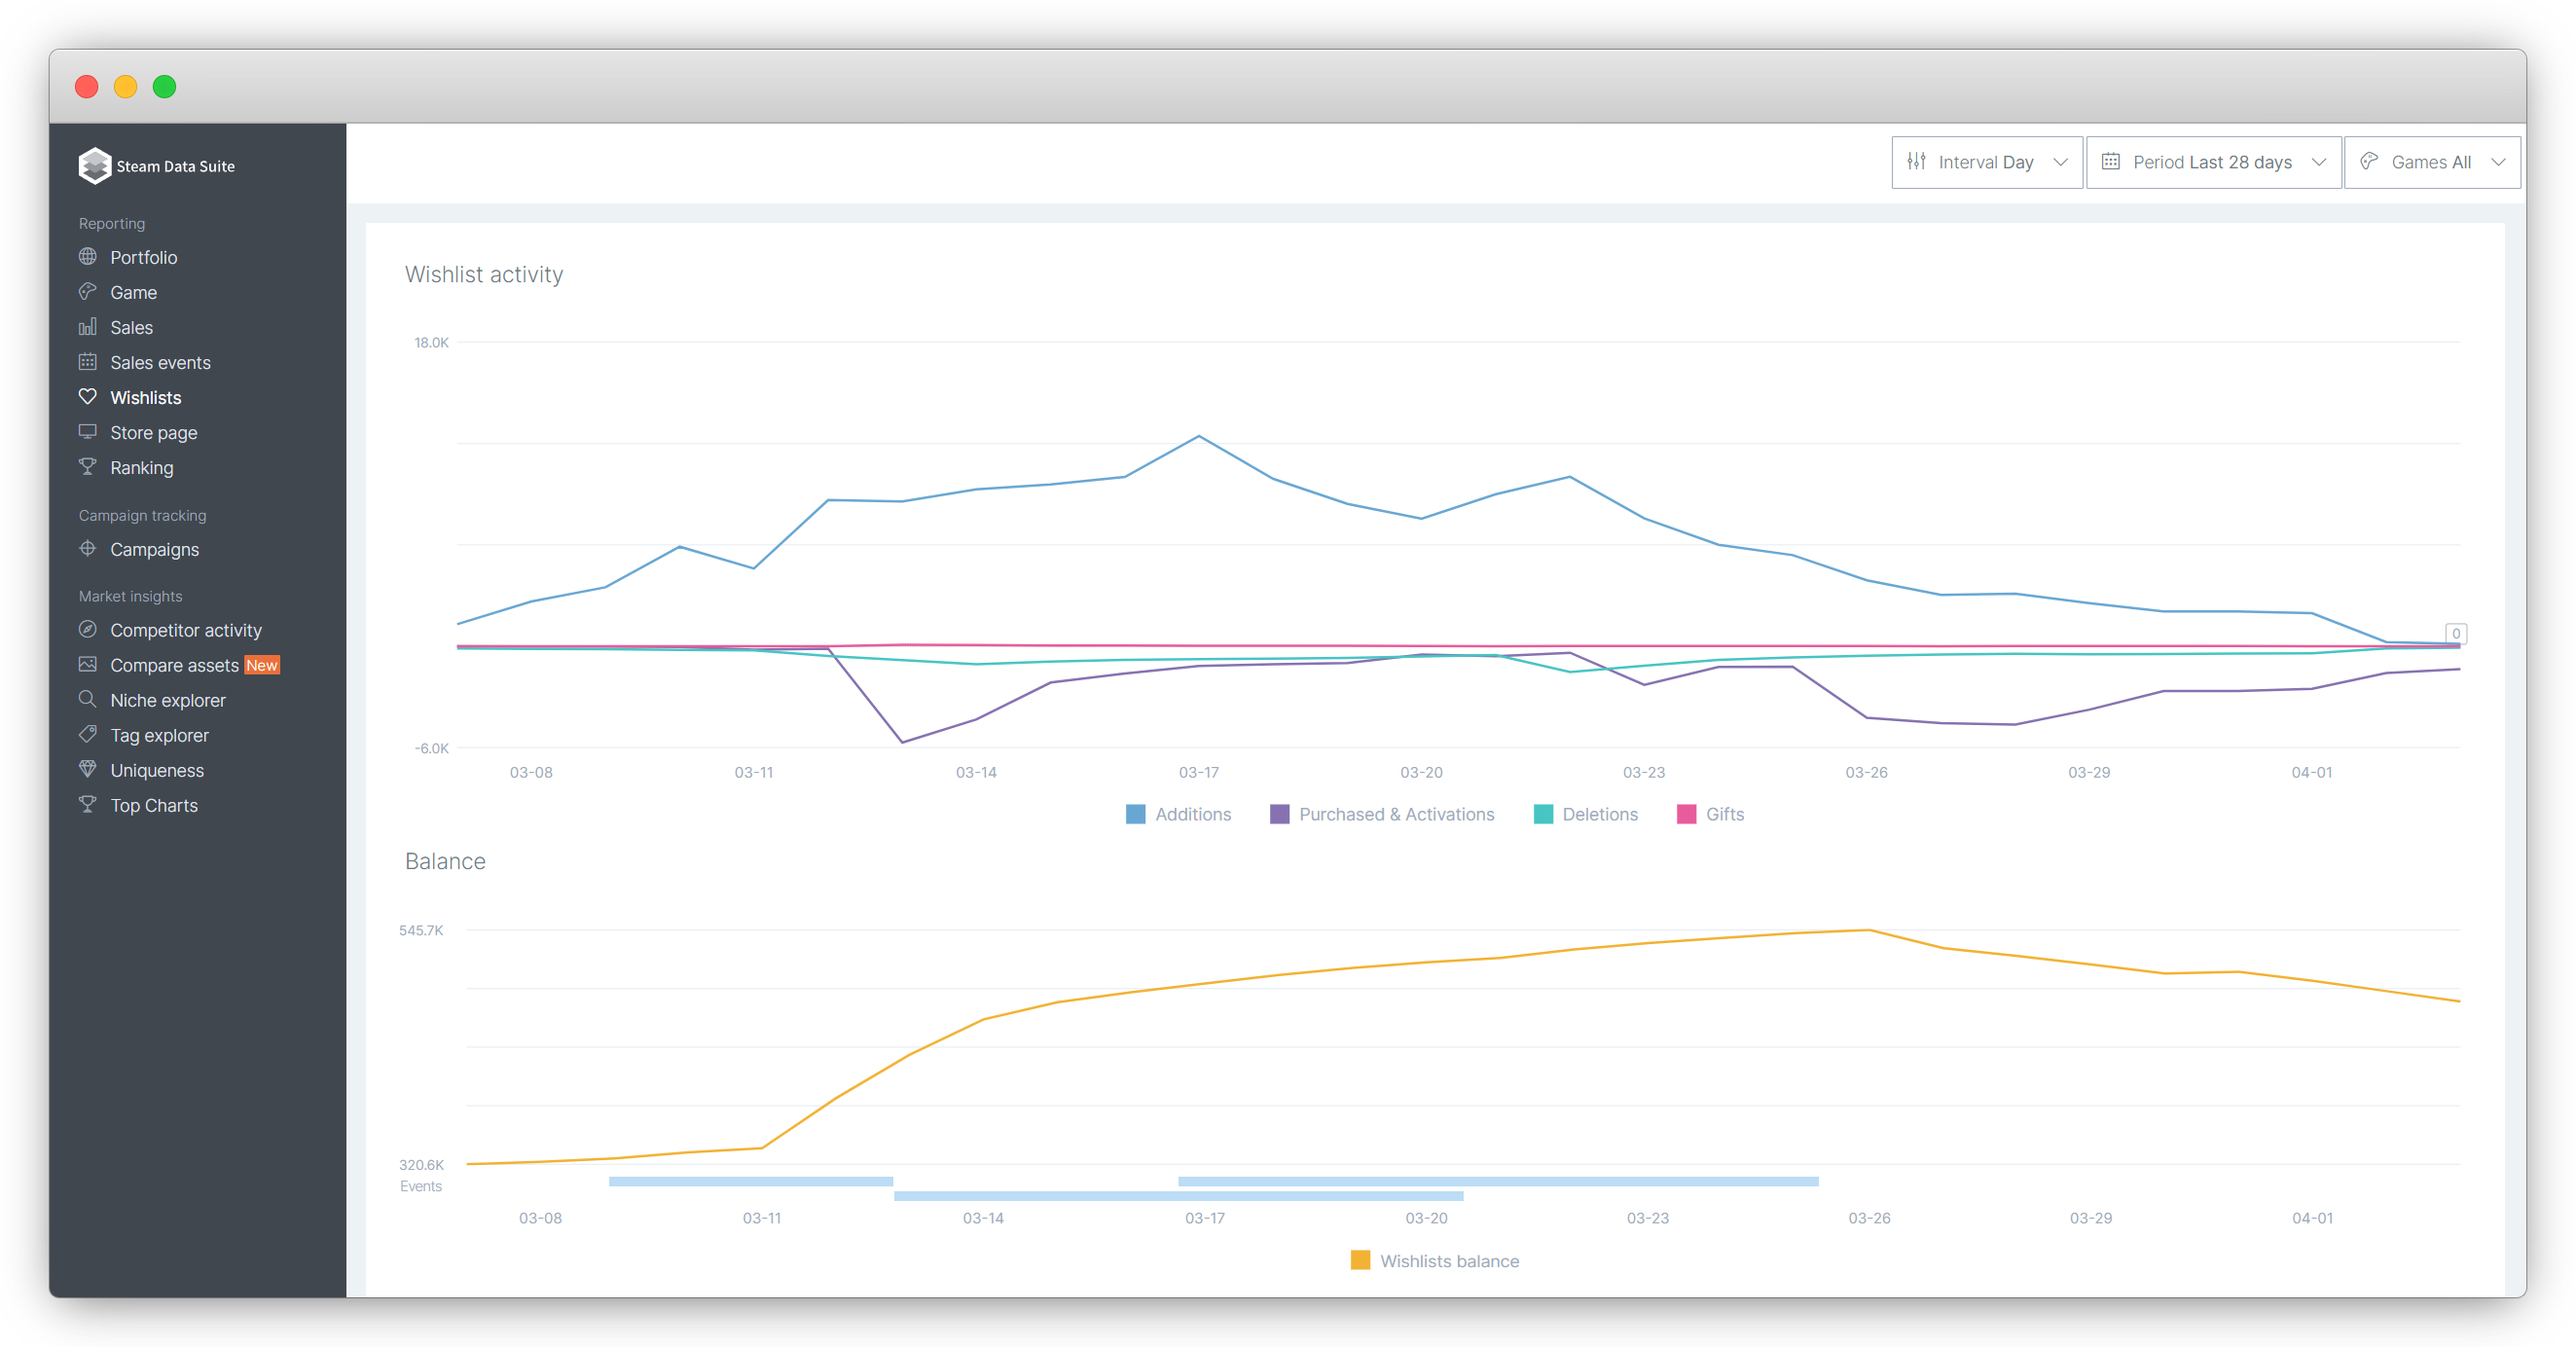
Wishlist activity is one of the most relevant sales performance metrics for Steam games. That’s why we have created the wishlist tool, which helps you closely monitor any developments pertaining to your games’ wishlist performance. Stay on top of your wishlist balance, and these with sales events, to understand their effects on your games’ wishlist balance. This will help you optimize for wishlist conversion in the long run. The wishlist tool reports:
- Wishlist balance
- Net wishlists
- Conversions
- Additions
- Purchases & Activations
- Deletions
- Gifts
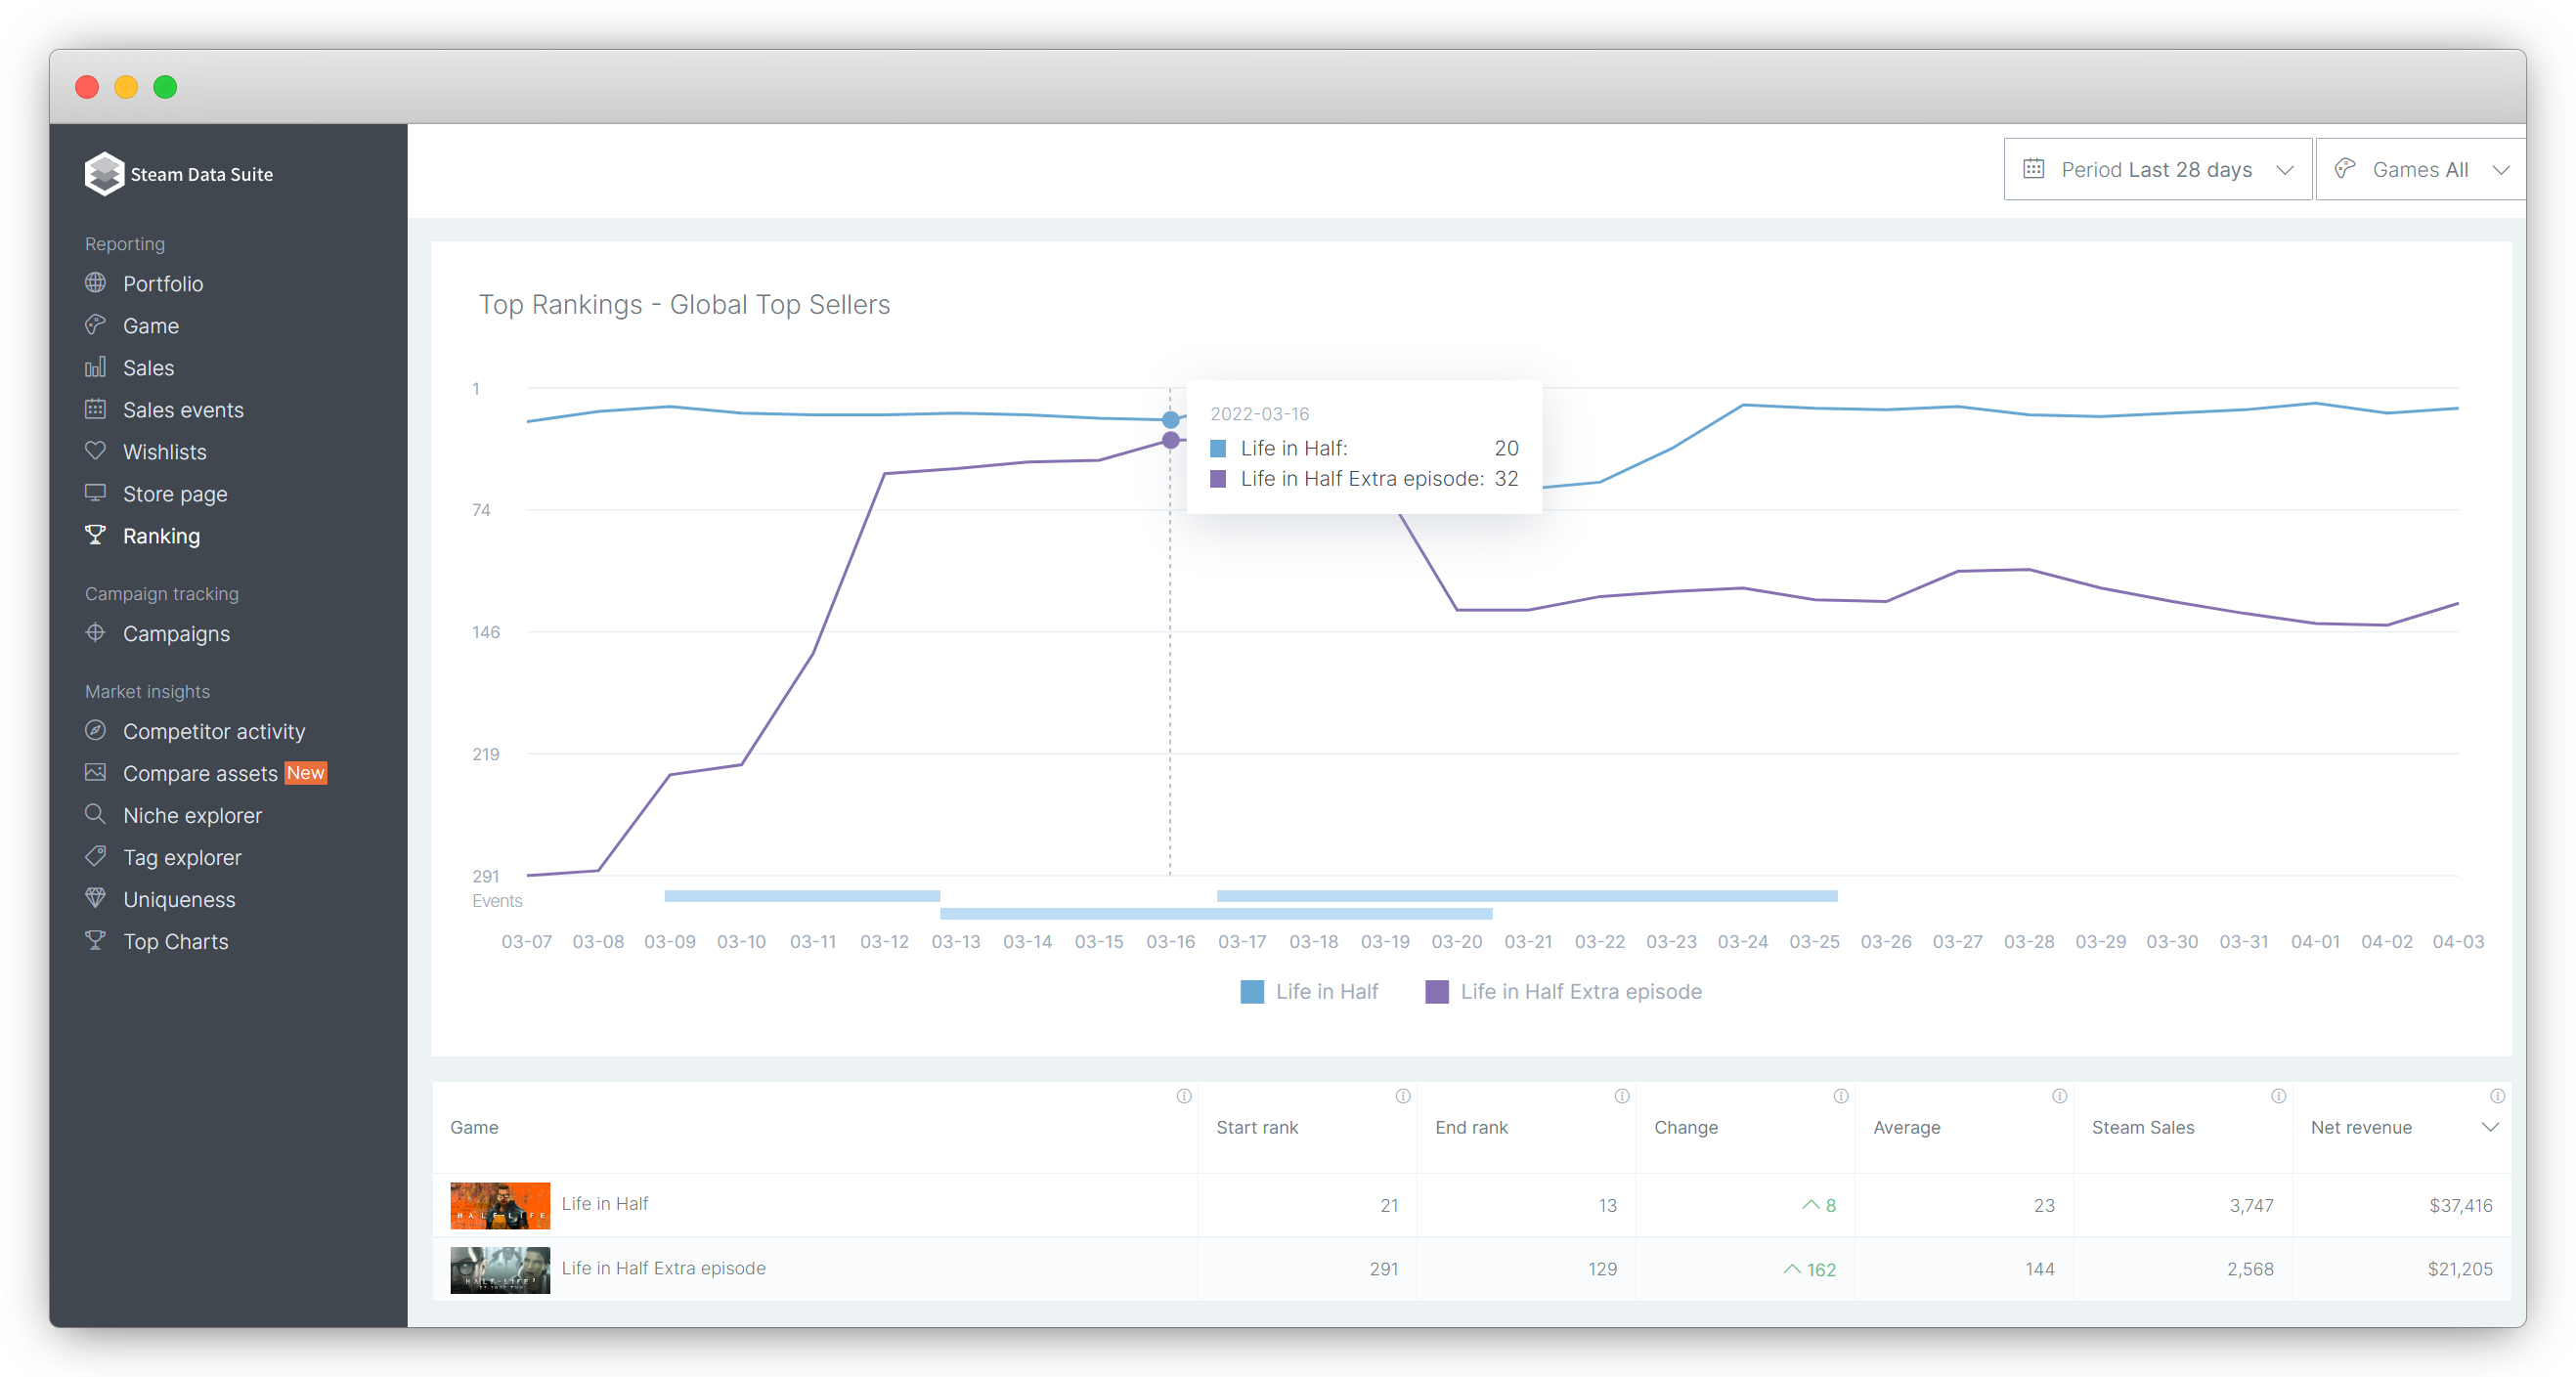
Ranking
The Ranking tool helps you keep track of your games’ position in Steam’s Global Top Sellers list. Since a game’s ranking on Steam directly correlates to its revenue generation and vice versa, it is a great indicator of how well the store’s algorithm will be featuring your game. That’s why suggest always keeping a close eye on your games’ position in the Top Sellers list in order to better understand your games’ sales performance. The ranking tool highlights all relevant ranking metrics for your games, including:
- Start rank
- (Current) end rank
- Change in rank
- Average rank
- Steam sales
- Net revenue
We’ll be happy to get your feedback about our insights, tools and features at info@steamdatasuite.com.