Reporting, the way we do it, makes complex data accessible and comprehensible, so your job is easier and your decisions are better
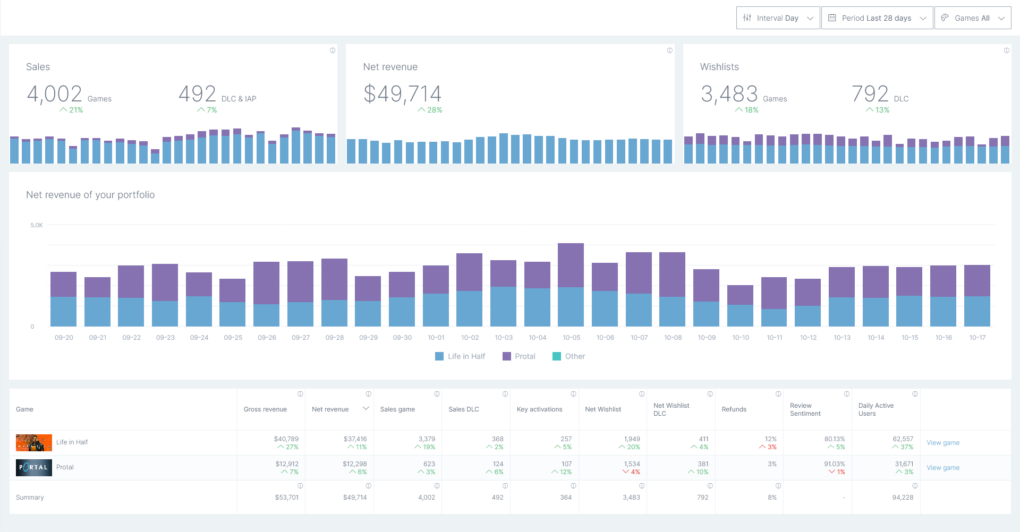
A portfolio dashboard provides all your KPI's at a glance.
Our portfolio and game dashboards provide you with a clear overview of your sales data, all in one spot. Evaluate your portfolio’s sales, net revenue and wishlist performance.
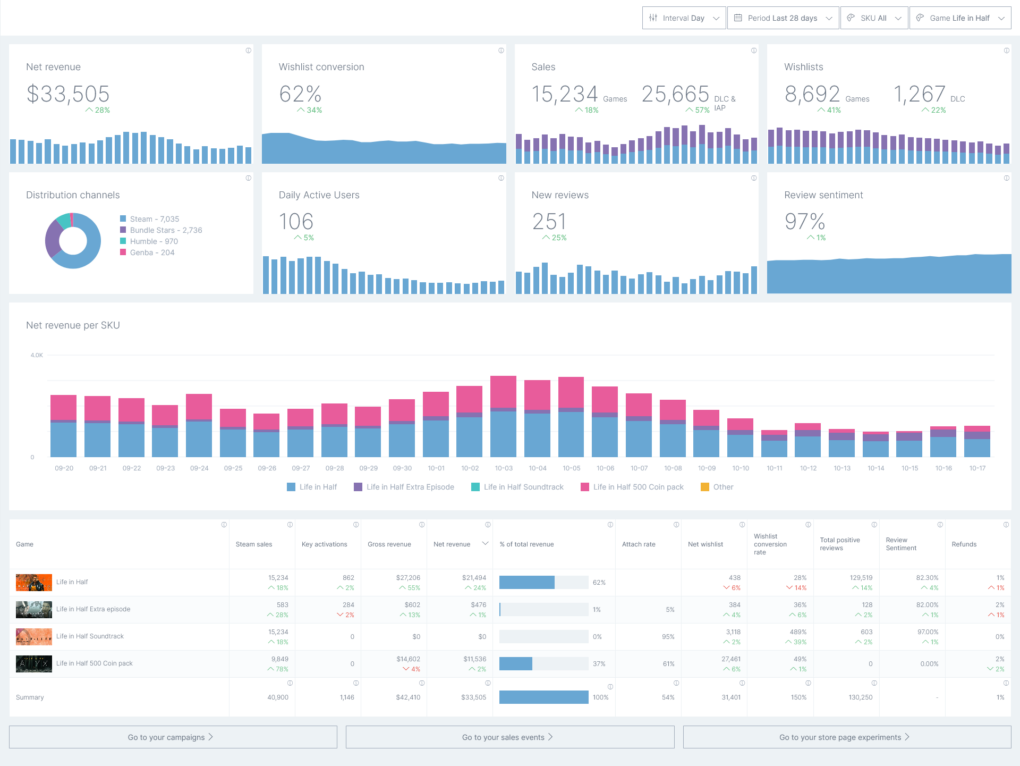
Advanced sales reporting sum up your game in great detail.
Look at your sales through one of many lenses and easially get the insights to make strategical decisions. Learn everything about geographical performance, compare (key) distribution channels or zoom in on platform usage.
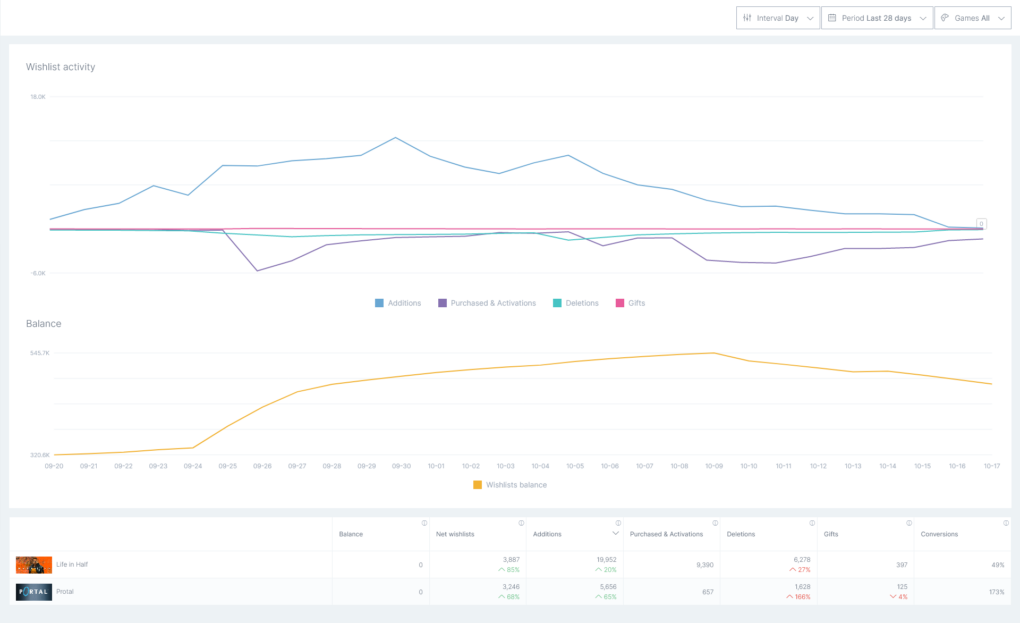
Wishlist reporting identifies what works to increase wishlists.
A simple overview involving all the metrics you need to understand the development of your wishlists over time. Combining additions and deductions, as well as wishlist balance, it helps you evaluate the efforts aimed at growing wishlists.
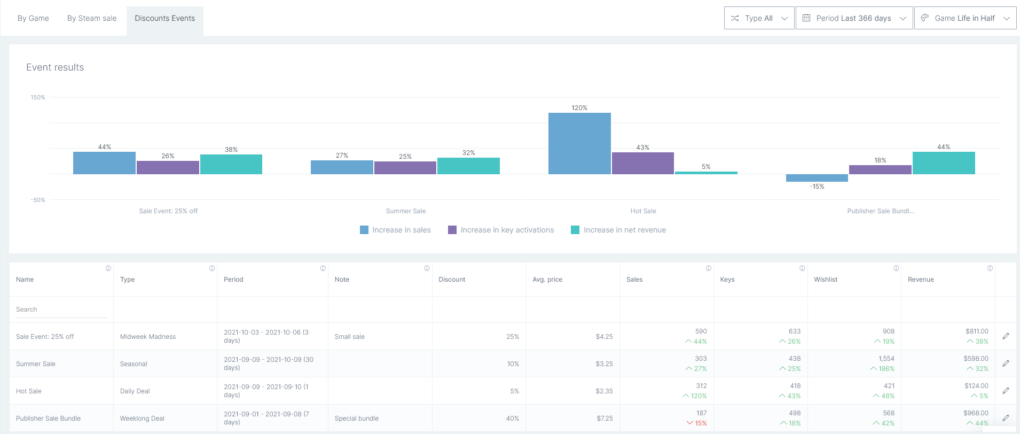
Sales events provide the ultimate feedback from promotions.
Doing on-platform promotions, your main questions will be: what was the effect, and how can I do better next time? We compare actual results to algorithmic predictions and help you find answers.
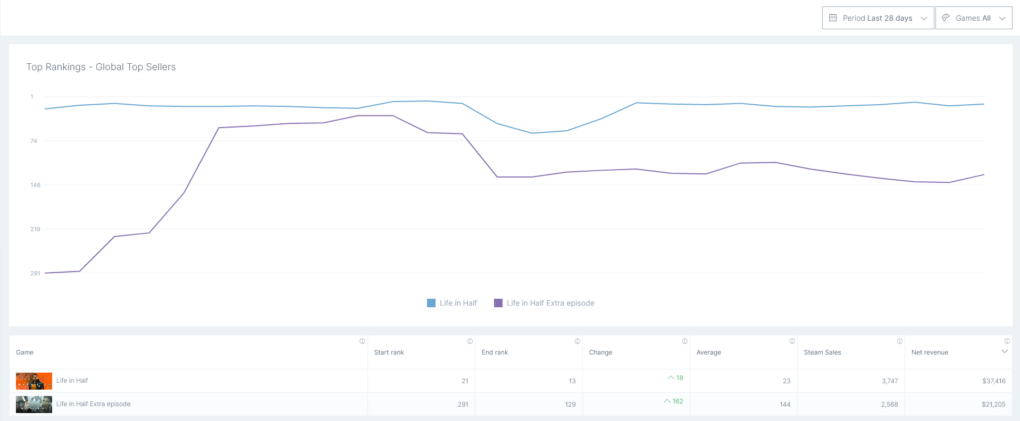
Ranking reports and the KPI that drives visibility.
Your top sellers rank is a great indicator of how well the store’s algorithm will be featuring your game. Therefore, knowing how this KPI evolves over time is crucial for efficient optimization.
Reporting is just one part of the complete suite.
Optimization
Assess the impact of changes to your store presence and get more visibility and store page conversion.